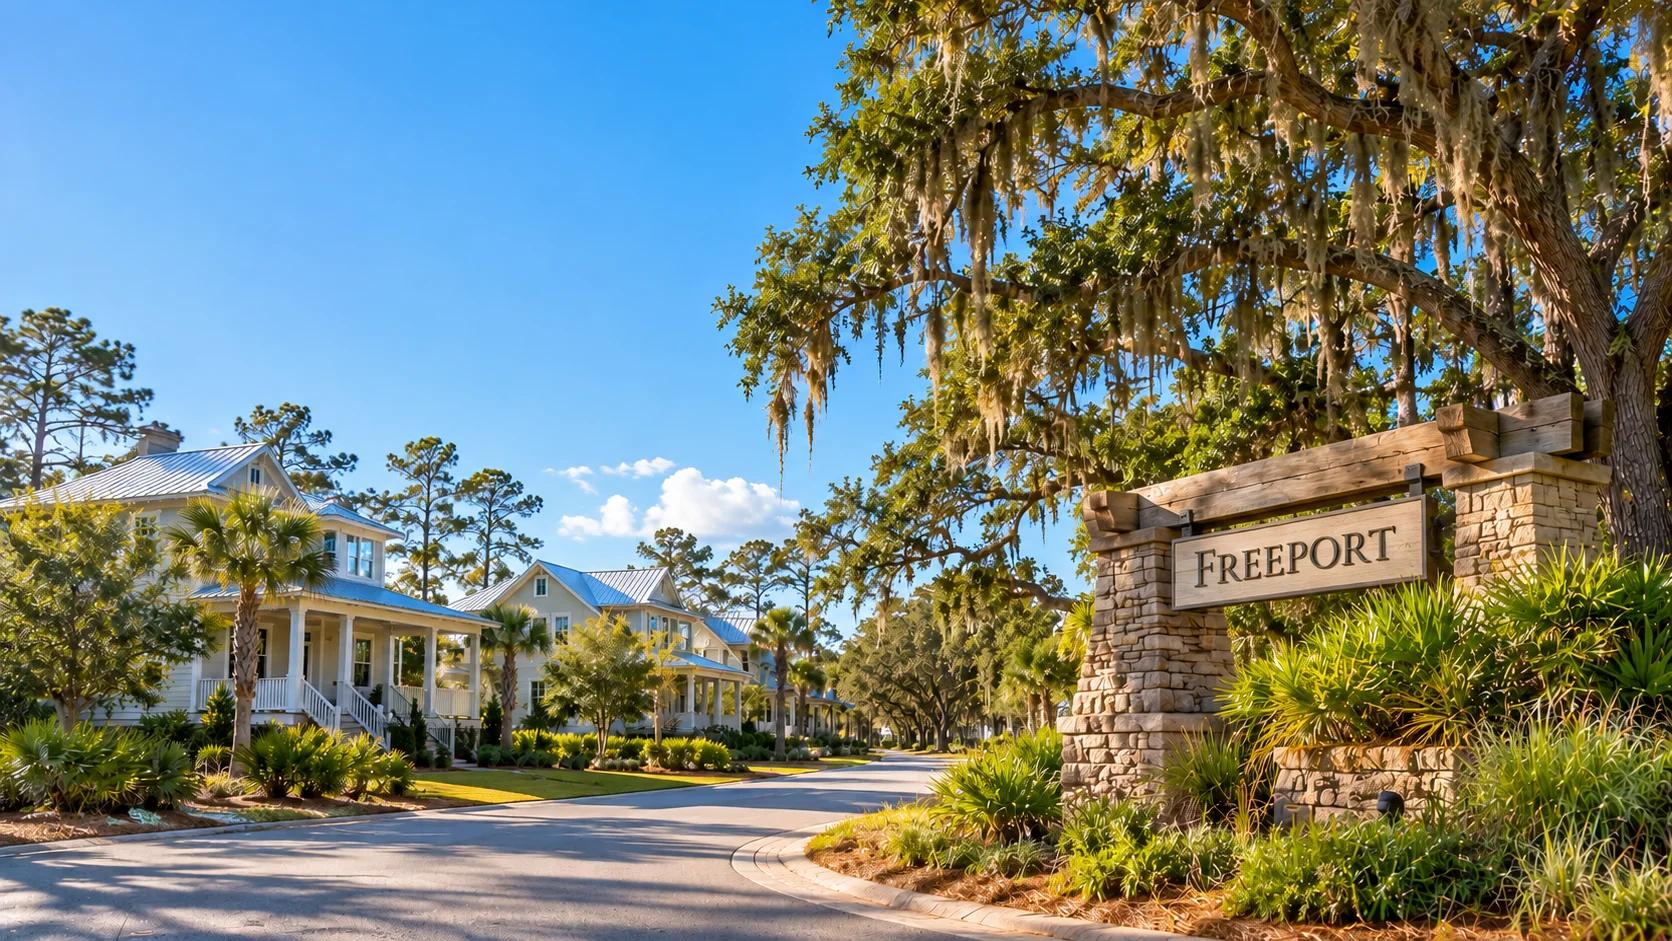
A Freeport neighborhood street on a bright day: white cottages with metal roofs and front porches, palms and live oaks hung with Spanish moss, and a stone entry sign reading Freeport.

Real Estate

Freeport's housing market

Home prices in Freeport

About these numbers

From 899 recorded sales in the Freeport ZIP code (32439) in Sep 2025–Aug 2026, compared with the same months a year earlier (Sep 2024–Aug 2025). A description of what already happened, not a forecast. “Steady” means the median moved less than 3% either way. A change is green when it rose and red when it fell, with its arrow: the color says which way it went, not whether that is good news (a rise is good for a seller and bad for a buyer).

The newest sales come from the Walton County Property Appraiser's own records, received Oct 1, 2026, and run to Sep 18, 2026; earlier months are the state's published files, which the appraiser's records match month by month. A sale can reach the records weeks after it closes, so September 2026 is still being recorded (40 sales so far) and every figure stops at August 2026: from its end to the day the newest records arrived is about 2 months. Anything that sold after Sep 18, 2026 is not here yet.

Price per square foot is the median of price divided by heated living area, for existing homes with a size on record: new homes are left out of every period, because the appraiser measures them only months after they are finished. Sizes are the heated living area the county property appraiser measured: the heated and cooled rooms, the figure a listing usually quotes. Total area adds the garage, porches and storage. With fewer than 10 sales a median is not quoted. The small lines under the figures are the last 12 complete months, a rolling three-month median for prices (each point needs 5 sales) and the count of homes sold each month.

Prices are steady

Median sale price $385,500 for homes sold Sep 2025–Aug 2026, 1.2% lower than Sep 2024–Aug 2025 ($390,000).

Updated Oct 10 · next update expected soon

Sales in Sep 2025–Aug 2026

Price trend

Sep 2024–Aug 2026

About the price trend

Sep 2024–Aug 2026. The shaded periods are the two the headline compares (Sep 2024–Aug 2025 and Sep 2025–Aug 2026), each with its median drawn across it, so the chart and the headline always agree. The line between them is context: how prices moved from one period to the other.

Each point is a median of at least 5 sales; a point with fewer is left out and a faint dashed line bridges it.

Median sale price, rolling 3 months

  • Sep 2024–Aug 2025 · median $390,000 · 810 sales
  • Sep 2025–Aug 2026 · median $385,500 · 899 sales
View data as a table
Median sale price, rolling 3 months, with the number of sales behind each point
PeriodMedian priceSales
Jul–Sep 2024$396,300201
Aug–Oct 2024$388,900199
Sep–Nov 2024$395,500195
Oct–Dec 2024$394,100197
Nov 2024–Jan 2025$392,450184
Dec 2024–Feb 2025$384,000189
Jan–Mar 2025$380,900186
Feb–Apr 2025$380,000197
Mar–May 2025$389,800203
Apr–Jun 2025$399,900211
May–Jul 2025$400,200223
Jun–Aug 2025$393,000223
Jul–Sep 2025$379,900209
Aug–Oct 2025$380,650194
Sep–Nov 2025$396,700169
Oct–Dec 2025$393,400199
Nov 2025–Jan 2026$395,850192
Dec 2025–Feb 2026$406,500202
Jan–Mar 2026$400,000176
Feb–Apr 2026$379,450212
Mar–May 2026$358,000245
Apr–Jun 2026$375,750286
May–Jul 2026$379,100285
Jun–Aug 2026$390,000283

What stands out

  • Prices about the same

    The median sale price was $385,500 in Sep 2025–Aug 2026, against $390,000 in Sep 2024–Aug 2025.

  • 11% more sales

    899 homes sold in Sep 2025–Aug 2026, against 810 in Sep 2024–Aug 2025.

  • $203 per sq ft

    The median price per square foot of heated living area, for existing homes sold in Sep 2025–Aug 2026. About the same as Sep 2024–Aug 2025.

  • 48% were new homes

    430 of the 899 sales in Sep 2025–Aug 2026 were new homes: sold the year they were built, or so new that the tax roll still lists the lot as empty.

  • Busiest stretch: Mar–Jun

    Sales usually pick up from March to June: busier than November to January in 4 of the 5 years 2021–2025.

Where homes sold

899 sales in Freeport, Sep 2025–Aug 2026, by price

  • Under $200K22
  • $200K–$300K108
  • $300K–$400K353
  • $400K–$500K176
  • $500K–$600K130
  • $600K–$700K50
  • $700K+60

The median, $385,500, is in the $300K–$400K band.

Records this period

Sep 2025–Aug 2026

What $500K buys

How this is worked out

$500,000 ÷ $203 a square foot = 2,463 sq ft, rounded to the nearest 10. $203 is the median price per square foot of heated living area of the 466 existing homes with a size on record sold in Sep 2025–Aug 2026.

In Sep 2024–Aug 2025: $500,000 ÷ $206 = 2,427 sq ft, from 400 sales.

New homes are left out of every period, because the appraiser measures them only months after they are finished. A guide to size, not a valuation: location, age and condition move any one home's price.

About 2,460 sq ft

of an existing home at the median $203 a sq ft, Sep 2025–Aug 2026

2,430 sq ft in Sep 2024–Aug 2025, at $206 a sq ft

Monthly payment

How the payment is worked out

Principal and interest on a 30-year fixed loan of $308,400 ($385,500 less 20% down, $77,100) at 7.11% a year, by the standard loan formula: the same payment every month for 360 months.

The rate is Freddie Mac's national average for a 30-year fixed mortgage, week of Nov 12, 2026, as published. A lender's rate depends on the borrower, the loan and the day.

Not included: property taxes, homeowners and flood insurance, HOA dues and mortgage insurance, which can add a great deal near the coast.

$2,075a month, rough estimate

For the median sale, $385,500 (Sep 2025–Aug 2026), with 20% down.

A 30-year fixed rate of 7.11% (Freddie Mac, week of Nov 12, 2026).

Taxes, insurance and HOA dues are not included.

Follow your home

We tell you when a home within half a mile of yours sells and when your home's county value changes. The first weekly email of each month compares your home with the market.

The market right now

ZIP 32439, from national sources that report sooner than recorded sales.

For sale now

Homes listed for sale in October 2026, against the same month a year earlier.

Homes for sale

252

Up compared with Oct 2025:  1.6%

Median asking price

$430K

Down compared with Oct 2025:  4.5%

Days listed

101 days

Up compared with Oct 2025:  20 days

Listings with a price cut

19%

Down compared with Oct 2025:  7 percentage points

60 new listings · 122 under contract in October 2026.

Asking prices, not sale prices. Source: Realtor.com® Economic Research, ZIP 32439.

Home values and rents

Zillow estimates for September 2026, and the federal price index.

All homes

$388K

Down compared with Sep 2025:  2.2%

Typical value of all homes, Sep 2025–Sep 2026

Single-family

$390K

Down compared with Sep 2025:  2.1%

Rent

$1,969/mo

Down compared with Sep 2025:  0.8%

A typical value is Zillow's estimate for a mid-priced home, not a sale. Source: Zillow Home Value Index and Observed Rent Index, ZIP 32439.

Federal price index: each year vs the year before

  • 2021up  22.2%
  • 2022up  18.7%
  • 2023up  5.5%
  • 2024up  1.2%
  • 2025up  1.0%

Built from sales and appraisals of homes whose mortgages Fannie Mae or Freddie Mac bought or guaranteed; FHFA calls these indexes developmental. Source: FHFA House Price Index, ZIP 32439, updated March 31, 2026.

Mortgage rates

National averages, week of Nov 12, 2026.

30-year fixed

7.11%

Down compared with last week:  0.07 percentage points

15-year fixed

6.45%

Down compared with last week:  0.12 percentage points

The 30-year rate is 0.87 percentage points higher than a year ago.

Source: Freddie Mac Primary Mortgage Market Survey®.

Listing market

From Redfin, for the latest months it has. The area you pick does not change these.

Buyer's or seller's market?

Buyer's or seller's market?

Months of supply is how long the homes for sale would last at the recent pace of sales. Under 4 months is usually called a seller's market, 4 to 6 balanced, and over 6 a buyer's market.

Lots of homes for sale compared with buyers means buyers have more choice and room to negotiate, and prices tend to flatten or fall.

Buyer's market

  1. Seller's
  2. Balanced
  3. Buyer's (this market)

8.1 months of supply

Down compared with Jun 2024–May 2025:  1.9 months

At the recent pace of sales, it would take about 8.1 months to sell the homes now for sale.

Walton County, Jun 2025–May 2026, average of 12 months

Days to sell

103 days

Up compared with Jun 2024–May 2025:  23.8 days

Median days from listing to sale · ZIP 32439, Jun 2025–May 2026, average of four 3-month periods

Source: Redfin Data Center. Redfin does not publish months of supply for ZIP 32439, so that figure is for all of Walton County, which includes beach communities that can behave differently from Freeport.

About these numbers

From 899 recorded sales in the Freeport ZIP code (32439) in Sep 2025–Aug 2026, compared with the same months a year earlier (Sep 2024–Aug 2025). A description of what already happened, not a forecast. “Steady” means the median moved less than 3% either way. A change is green when it rose and red when it fell, with its arrow: the color says which way it went, not whether that is good news (a rise is good for a seller and bad for a buyer).

The newest sales come from the Walton County Property Appraiser's own records, received Oct 1, 2026, and run to Sep 18, 2026; earlier months are the state's published files, which the appraiser's records match month by month. A sale can reach the records weeks after it closes, so September 2026 is still being recorded (40 sales so far) and every figure stops at August 2026: from its end to the day the newest records arrived is about 2 months. Anything that sold after Sep 18, 2026 is not here yet.

Price per square foot is the median of price divided by heated living area, for existing homes with a size on record: new homes are left out of every period, because the appraiser measures them only months after they are finished. Sizes are the heated living area the county property appraiser measured: the heated and cooled rooms, the figure a listing usually quotes. Total area adds the garage, porches and storage. With fewer than 10 sales a median is not quoted. The small lines under the figures are the last 12 complete months, a rolling three-month median for prices (each point needs 5 sales) and the count of homes sold each month.

Sources, method and limits

Recorded sales. Florida Department of Revenue Sale Data File and property roll for Walton County (2026F roll, posted Oct 5, 2026); from September 2026 on, the Walton County Property Appraiser's own sale records (received Oct 1, 2026), the file the state's is made from: over the 12 months both cover they count the same sales in 12 and are within two in 12; parcel locations from Walton County GIS. Kept: qualified (arm's-length) sales, codes 01 and 02; improved single-family, mobile-home and condo parcels; price of $20,000 or more, plus new homes the newest roll still lists as empty lots (the roll describes each parcel as it was on 1 January, so a house finished later is still a lot on it; its sale is counted when it is a deed for that one lot at four or more times the lot's value). Other transfers (family transfers, foreclosure and bank sales, multi-parcel deals, lot sales) are left out because they do not reflect the open market for homes. Our records start Jan 4, 2021 and end Sep 18, 2026; the state publishes a few times a year, and the county's next file is due in the fall; the appraiser sends its records when we ask. A sale can reach the records weeks after it closes, so the month of the newest sale (September 2026) is still being recorded and is left out of every figure; the figures stop at the month before it. Measured: the state's 2026 Final file counted 28 sales in September 2026; the appraiser's records now count 40. Owner names are never shown.

How the figures are worked out. Median price, homes sold and price per square foot come from these recorded sales only, over whole calendar months, for the time range and the area (the whole place or a neighborhood) you have picked; the map's view narrows only the sales listed under it. On 1 to 12 months, each is compared with the same months a year earlier (housing has a season, so spring is set against spring); on 3 or 5 years, the range's last 12 months are compared with its first 12. With fewer than 10 sales in a period the median is not quoted, and a change is shown only when both periods have at least 10 sales and our records cover the earlier one. Price per square foot uses the heated living area from the county property appraiser's building records, skips homes smaller than 300 sq ft, and leaves out new homes in every period (the appraiser measures them only months after they are finished). Sizes are the heated living area the county property appraiser measured: the heated and cooled rooms, the figure a listing usually quotes. Total area adds the garage, porches and storage. The price, bedroom and new-construction filters change the dots on the map and the sales listed, not the figures. The headline and the “what stands out” cards are written by rules from those same numbers, not by AI, and describe what already happened.

Neighborhoods. Subdivision names read from each parcel's legal description; pods of one community merged; outlines drawn around the parcels carrying the name. Not official boundaries. 87% of the 4,700 sales fall in a neighborhood with at least 12 sales; the rest are in smaller subdivisions or on land described by boundaries rather than a plat. The county publishes no subdivision boundary layer, so the outlines are drawn around the parcels that carry each name and are approximate. Source: Legal descriptions in the Walton County property appraiser's parcel file (Public-GIS-Data-2026-07-28.zip).

Listing market. Days to sell and months of supply are from Redfin Data Center, latest period May 31, 2026 (all residential property types; county figures are monthly, ZIP figures are rolling 3-month windows), for the same months as the figures above where Redfin has them. Redfin only counts homes listed through agents and MLS, its figures for a small ZIP can swing from month to month, and they do not change with the map.

Nearby projects. From the Development section: projects we could place on a map, by straight-line distance. A decision on a project we could not place does not appear.

Map: OpenFreeMap, © OpenMapTiles, data © OpenStreetMap contributors.

Sales map · 12 months

Color the dots by

Sale price

  • Under $325K
  • $325K–$400K
  • $400K–$500K
  • $500K+

899 sales in Sep 2025–Aug 2026.

Neighborhoods

Most sales, Sep 2025–Aug 2026

  • See more with BasicPart of Basic

    Members see every neighborhood's prices, and each neighborhood's own page. Basic is $4.99 a month or $49 a year. What is happening in town stays free.

    Busiest
    $512,900 median · 217 sales

    Up compared with Sep 2024–Aug 2025:  2.4%

  • See more with BasicPart of Basic

    Members see every neighborhood's prices, and each neighborhood's own page. Basic is $4.99 a month or $49 a year. What is happening in town stays free.

    $368,700 median · 150 sales

    Up compared with Sep 2024–Aug 2025:  5.2%

  • See more with BasicPart of Basic

    Members see every neighborhood's prices, and each neighborhood's own page. Basic is $4.99 a month or $49 a year. What is happening in town stays free.

    Biggest change
    $350,000 median · 105 sales

    Down compared with Sep 2024–Aug 2025:  6.9%

  • See more with BasicPart of Basic

    Members see every neighborhood's prices, and each neighborhood's own page. Basic is $4.99 a month or $49 a year. What is happening in town stays free.

    $401,100 median · 65 sales

    No comparison

    too few sales in Sep 2024–Aug 2025

  • See more with BasicPart of Basic

    Members see every neighborhood's prices, and each neighborhood's own page. Basic is $4.99 a month or $49 a year. What is happening in town stays free.

    $332,500 median · 43 sales

    No comparison

    too few sales in Sep 2024–Aug 2025

Sales in Sep 2025–Aug 2026

Newest first, in the map's area. These filters change the map's dots too.

899 sales

What's changing nearby

Within 4 miles of the middle of the map

From other sources

Each with its own date. The range and the map do not change these.

About these numbers

The map shows the sales of Sep 2025–Aug 2026 in the Freeport ZIP code (32439); drag or zoom it and the sales listed under it follow. The price, bedroom and new-construction filters narrow the dots and the list, not the Market figures. Bedrooms are as the county records describe each home today.

Neighborhoods are recorded subdivisions and communities read from the parcels' legal descriptions, with outlines drawn around their parcels (approximate). A median needs 10 sales in the period; “Busiest” is the one with the most sales among those with a median, “Biggest change” the largest change either way among those whose change can be shown (at least 10 sales in both periods).

Nearby projects come from the Development section: projects on an agenda in the last 12 months, being built, or with a hearing ahead, by straight-line distance. A decision on a project we could not place on a map does not appear.

Sources, method and limits

Recorded sales. Florida Department of Revenue Sale Data File and property roll for Walton County (2026F roll, posted Oct 5, 2026); from September 2026 on, the Walton County Property Appraiser's own sale records (received Oct 1, 2026), the file the state's is made from: over the 12 months both cover they count the same sales in 12 and are within two in 12; parcel locations from Walton County GIS. Kept: qualified (arm's-length) sales, codes 01 and 02; improved single-family, mobile-home and condo parcels; price of $20,000 or more, plus new homes the newest roll still lists as empty lots (the roll describes each parcel as it was on 1 January, so a house finished later is still a lot on it; its sale is counted when it is a deed for that one lot at four or more times the lot's value). Other transfers (family transfers, foreclosure and bank sales, multi-parcel deals, lot sales) are left out because they do not reflect the open market for homes. Our records start Jan 4, 2021 and end Sep 18, 2026; the state publishes a few times a year, and the county's next file is due in the fall; the appraiser sends its records when we ask. A sale can reach the records weeks after it closes, so the month of the newest sale (September 2026) is still being recorded and is left out of every figure; the figures stop at the month before it. Measured: the state's 2026 Final file counted 28 sales in September 2026; the appraiser's records now count 40. Owner names are never shown.

How the figures are worked out. Median price, homes sold and price per square foot come from these recorded sales only, over whole calendar months, for the time range and the area (the whole place or a neighborhood) you have picked; the map's view narrows only the sales listed under it. On 1 to 12 months, each is compared with the same months a year earlier (housing has a season, so spring is set against spring); on 3 or 5 years, the range's last 12 months are compared with its first 12. With fewer than 10 sales in a period the median is not quoted, and a change is shown only when both periods have at least 10 sales and our records cover the earlier one. Price per square foot uses the heated living area from the county property appraiser's building records, skips homes smaller than 300 sq ft, and leaves out new homes in every period (the appraiser measures them only months after they are finished). Sizes are the heated living area the county property appraiser measured: the heated and cooled rooms, the figure a listing usually quotes. Total area adds the garage, porches and storage. The price, bedroom and new-construction filters change the dots on the map and the sales listed, not the figures. The headline and the “what stands out” cards are written by rules from those same numbers, not by AI, and describe what already happened.

Neighborhoods. Subdivision names read from each parcel's legal description; pods of one community merged; outlines drawn around the parcels carrying the name. Not official boundaries. 87% of the 4,700 sales fall in a neighborhood with at least 12 sales; the rest are in smaller subdivisions or on land described by boundaries rather than a plat. The county publishes no subdivision boundary layer, so the outlines are drawn around the parcels that carry each name and are approximate. Source: Legal descriptions in the Walton County property appraiser's parcel file (Public-GIS-Data-2026-07-28.zip).

Listing market. Days to sell and months of supply are from Redfin Data Center, latest period May 31, 2026 (all residential property types; county figures are monthly, ZIP figures are rolling 3-month windows), for the same months as the figures above where Redfin has them. Redfin only counts homes listed through agents and MLS, its figures for a small ZIP can swing from month to month, and they do not change with the map.

Nearby projects. From the Development section: projects we could place on a map, by straight-line distance. A decision on a project we could not place does not appear.

Map: OpenFreeMap, © OpenMapTiles, data © OpenStreetMap contributors.

Keep track with BasicPart of Basic

Members can , and see it all in one place on the Saved tab. Basic is $4.99 a month or $49 a year. What is happening in town stays free.

Recorded sales through Sep 18, 2026 · Independent, not an official city site · About · Sources · Privacy · Terms · © 2026 Keep Watch App LLC